
For college athletics GMs
Know what changed.See the evidence.
Performance, visibility, and public coverage in one roster briefing.

Riverbend State Athletics
Interactive preview · fictional data
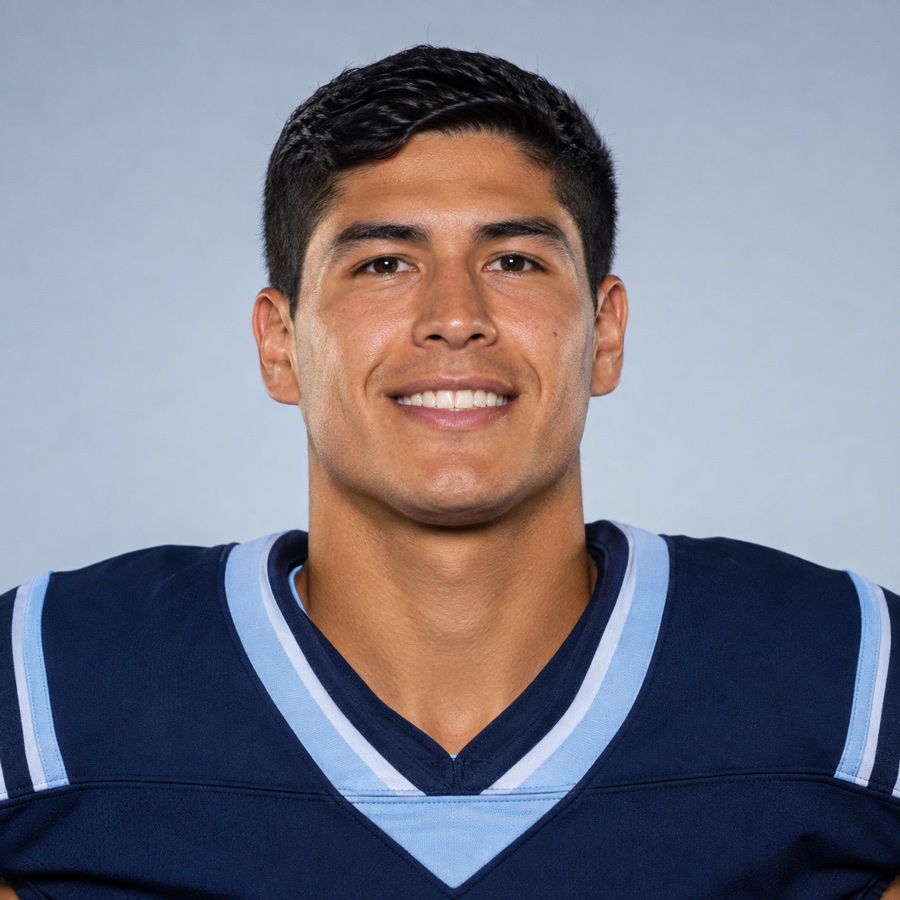
Alex Rivera
Quarterback · fictional example
Performance
91/ 100
Performance score
276 passing yards
22 / 30 completions
Social audience
82/ 100
Social score
12.4K followers
Instagram and X
News and media
86/ 100
Media exposure score
Dated story available
Coverage trend unknown
What deserves a closer look?
Fictional comparisons for illustration; not live monitoring.
Performance
198 → 276 passing yards
78 more yards than the previous sample game.
Social audience
10.8K → 12.4K followers
1.6K more followers across the sample snapshots.
News and media
5 dated stories in the sample week
Coverage includes game results, a player interview and a community appearance.
Position context: season passing yards, sample conference #3 of 18 QBs; national #24 of 240.
About this preview & coverage limits
Fictional athlete, institution, images, scores and observations. This is an illustration, not a screenshot or live account. Scores are not calculated from the small selection of evidence shown. Rank history is a concept; current position comparisons exist, but production historical-rank availability is not established. Follow-ups are suggestions, not assigned tasks. Public Coverage & Context describes sources, not character. Unknown periods are gaps, not zero coverage. The current model reports insufficient comparable coverage. Overall VR and modeled NIL context retain internal risk inputs; sensitive publication remains held.
Methodology & coverage limitsA clearer starting point for your next roster review.
Find the priority
Start with an athlete and their conference and national position context.
Get the context
Review performance, social audience and dated news together.
Prepare the conversation
Bring a sourced question to the right member of your staff.
Bring your next review task.
See how the briefing fits your program.